California Cities with the Best and Worst Bike Networks
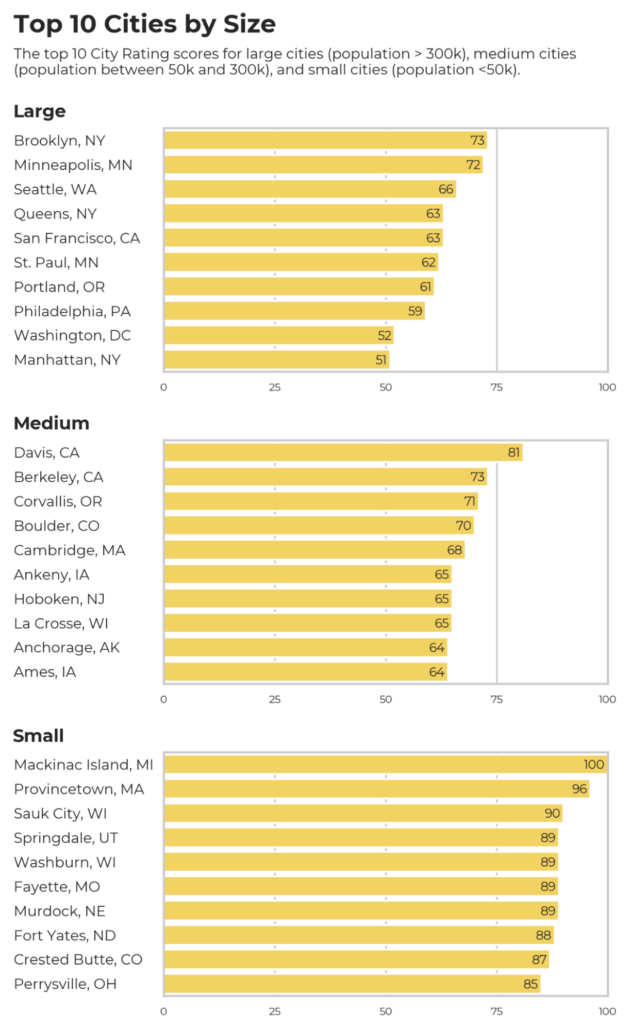
PeopleForBikes has released its 2025 City Ratings, assessing the connectedness and stress level of the bike networks in over 2,500 cities worldwide, including many in the U.S. The survey rated 305 California cities, with three placing in the national top 10 for their city size.
As CalBike works to pass the Bike Highways Bill, AB 891, it’s worth taking a closer look at how well our infrastructure serves people trying to get to common destinations by bike.
Ratings methodology
PeopleForBikes uses Bike Network Analysis (BNA), a software tool that automates the scoring process. The ratings assess levels of traffic stress of different types of bike infrastructure and access to jobs, educational institutions, core services, retail, and recreational facilities, as well as transit connections.
The survey looks at factors with the acronym SPRINT: safe speeds, protected bike lanes, reallocated space for biking and walking, intersection treatments, network connections, and trusted data. Communities are scored on a scale from 1 to 100. The only place that received a perfect score of 100 is Mackinac Island, Michigan, a car-free island in Lake Huron.
California cities in the top 10
Among large cities, San Francisco tied for fourth with a score of 63. The two top mid-sized cities are both in California: Davis, scoring 81, and Berkeley, with a score of 73. The top-ranked small cities skewed higher, so no California communities made the list, but Sonoma had the second-highest score in California at 74, and Ojai, Point Arena, Stanford, and Davenport all had scores of 65 or above.

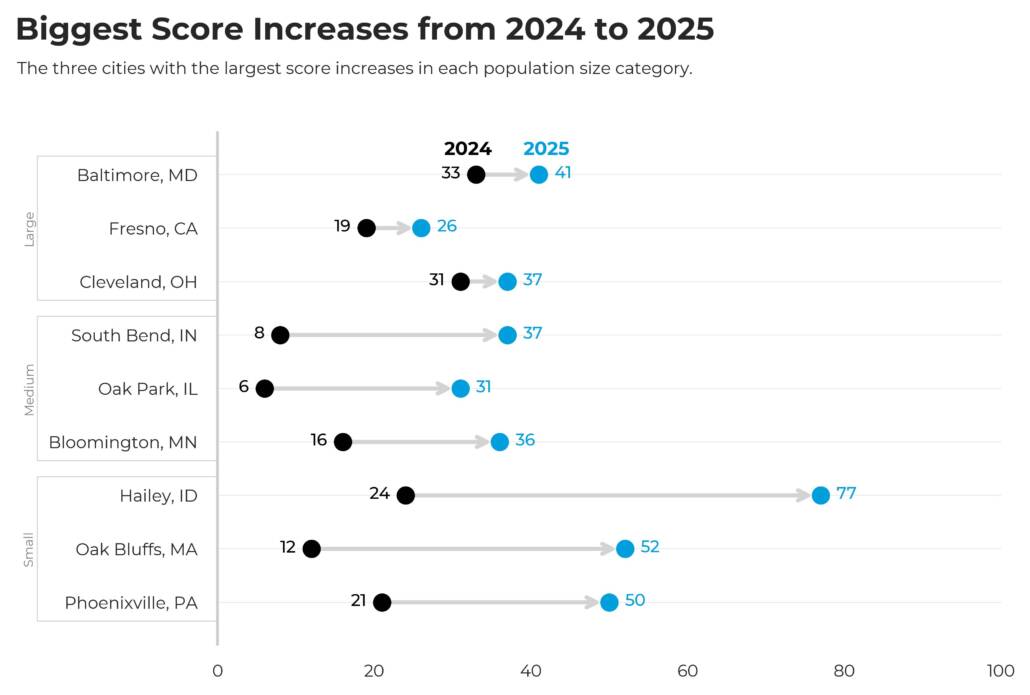
Fresno was one of the large cities with the most improvement, bumping its score from 19 to 26. While Fresno has a ways to go before it becomes a comfortable place to bike for people at all levels, it’s an impressive increase.

Chico made the list of cities on the rise, a designation for communities that have made big improvements in recent years. Chico’s score rose from 44 in 2019, the first year it was included in the survey, to 57 in 2025. Chico also has two bike projects in the pipeline that will improve its infrastructure further. See the PeopleForBikes Transformative Projects List to find infrastructure projects in your area.
California state rankings
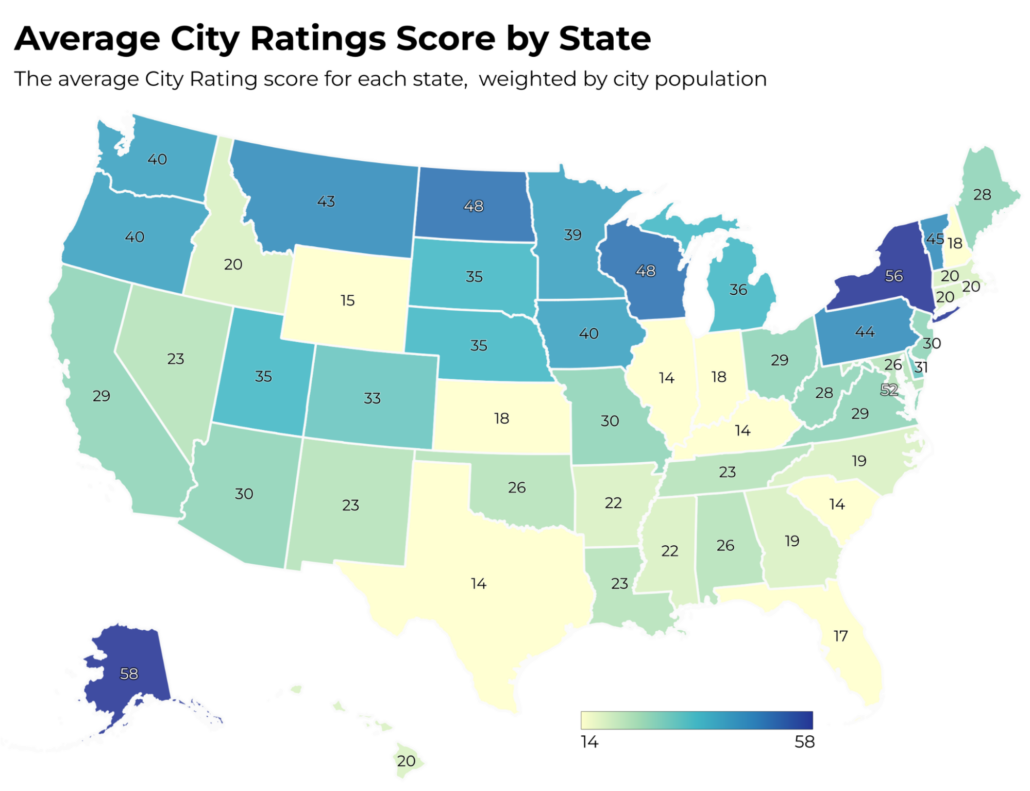
Many California cities stand out for their excellent or improving bike infrastructure, and 32 cities had ratings of 50 or above. But, as a state, our average ranking in 2025 is 29, one point below the national average of 30 and lower than the other West Coast states, which both had average rankings of 40.
The lowest-rated location in California was Penngrove, which got just 10 out of 100. Los Angeles scored 25. San Jose got a 33 and Sacramento a 36 rating.

It’s clear we have a lot of work to do to achieve CalBike’s vision of a transportation system that gives Californians choices of how to get around safely, rather than forcing people into cars. The Bike Highways Bill, AB 954, will create a pilot program to create regional protected, connected bike networks. It’s a critical step toward achieving the infrastructure we need for a future full of bikes, and it needs your support. Please send an email to support more bike highway networks.


